Membrane proteins are the main targets of therapeutic drugs and most of them carry some form of glycan structures, which play pivotal roles in protein folding, stability, cell communication, cell signaling, cell growth, protein structure and function, as well as antibody binding interactions.1 Glycosylation changes are a well-established hallmark of several types of cancer, including pancreatic cancer, that contribute to tumor growth.2 Therefore, new technologies that quantify and characterize glycosylation changes in cancer tissues are of paramount significance in biomarker discovery. There are two main types of glycans in membrane glycoproteins: O-linked and N-linked glycans.2
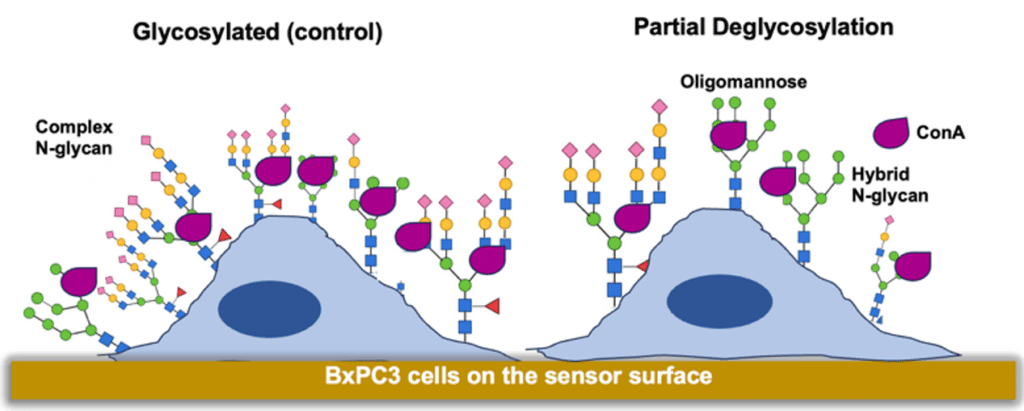
Figure 1: Adherent cells on sensor surface model for profiling N-linked glycans with ConA under glycosylated and partial deglycosylated conditions.
Consequently, profiling of N- and O-linked glycosylation is critical for the discovery of new diagnostics and cancer biomarkers, and to understand the function of tumorigenic membrane glycoproteins within the complex glycosylated cancer cellular environment. Lectins have been used extensively to identify and quantify glycans in biological samples to reveal their relative abundance or changes in cancerous tissues.3 Con A is one of the popular lectins, which does not bind the more prevalent N-linked tri and tetra antennary glycans overexpressed in malignant cells, and because of this it has been used extensively in cancer biomarker discovery.4 Additionally, this lectin has been used to verify enzymatic deglycosylation of N-linked glycans with PNGase F using end point analysis technologies in whole cells in the past.5 Therefore, Con A was implemented in this study to determine N-linked glycan binding kinetic changes directly in whole pancreatic cancer cells upon enzymatic deglycosylation with PNGase F, which specifically removes N-linked glycans.6
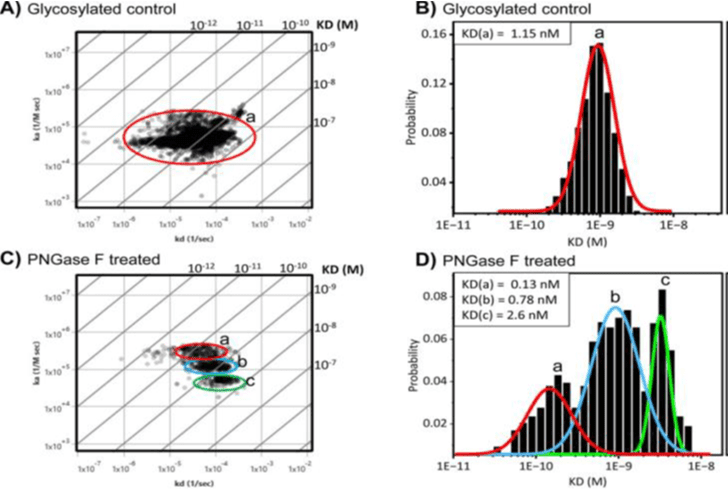
Figure 2: SPRm 200 study shows that Con A binding affinity and heterogeneity increases upon enzymatic N-linked deglycosylation of BxPC3 cells.
A) Affinity isotherm plot showing Con A binding population on glycosylated BxPC3 cells. B) Histogram describing total statistic kinetic interactions and distributions for Con A on glycosylated BxPC3 cells. C) Affinity isotherm plot extracted from hundreds of responsive ROIs for Con A on deglycosylated BxPC3 cells. D) Histogram describing total statistic of the kinetic interactions and distributions for Con A on deglycosylated BxPC3 cells. Diagonal lines of isoaffinity plots represent KD. a, b, and c represent binding interaction modes.
In this study, SPRm 200 instrument was used to study the influence of aberrant cell surface N-linked glycosylation on Con A binding kinetics and heterogeneity directly on pancreatic cancer cells (Figure 1), which is not possible with traditional approaches that require membrane protein isolation and purification for the study of binding kinetics, in addition to the fact that SPRM is currently the only technology in the market capable of determining binding heterogenity.7 To accomplish this, BxPC3 pancreatic cancer cells were treated with PNGase F enzyme to remove the majority of N-glycans. The kinetic parameters extracted from every responsive Con A binding ROI were aggregated to form affinity isotherm plots and histograms. To quantify the kinetic parameters of the predominant binding modes, gaussian distributions were fit to histograms of the kinetic interactions such that the mean values of the distributions revealed the predominate values for the equilibrium dissociation (KD), association rate (ka), and dissociation rate (kd) constants. A single predominant binding mode for Con A in glycosylated control BxPC3 cells was observed (Figure 2A and B) as determined by the affinity isotherm plot and histogram, producing the kinetic values listed in Table 1. However, after BxPC3 cells underwent PNGase F treatment to remove N-linked glycans, three distinct binding interaction modes for Con A on BxPC3 cells were observed (Figure 2C and D), as shown in the isoaffinity plot and histogram. A 1:1 binding model was applied to the analysis of all Con A kinetic data. However, the sub-cellular resolution of SPRM enables the usage of affinity isotherm plots to provide a uniquely informative representation of binding heterogeneity by revealing predominant modes of kinetic binding interactions that would otherwise be hidden with traditional endpoint and affinity measurement techniques.
| Cells | KD (nM) | ka (M-1S-1) | kd (s-1) |
| Glycosylated BXPC3 cells | a) 1.15 | a) 4.75X10⁴ | a) 4.3X10⁻⁵ |
| Deglycosylated BXPC3 cells | a) 0.13 b) 0.78 c) 2.6 | a) 2.9X10⁵ b) 1.2X10⁵ c) 5.3X10⁴ | a) 4.5X10⁻⁵ b) 8.6X10⁻⁵ c) 1.3X10⁻⁴ |
Table 1: Kinetic parameters of ConA binding to N-linked glycans on BxPC3 cells
The predominant binding modes are a consequence of various kinetic binding interactions resulting from cellular heterogeneity that are observed most frequently in the population. It has been reported in other studies that there are three predominant glycoforms that Con A binds to: high affinity for the oligomannose type N-glycans, moderate affinity for the hybrid type N-glycans, and weak affinity for bi-antennary complex type N glycans as shown in Figure 1.8 The results of this study show that upon partial removal of N-linked glycans, the various binding interaction modes for Con A can be better differentiated, thereby enabling the unique capability of SPRM to quantify heterogeneity and associated binding interaction kinetics. Also, these SPRm 200 results highlight the changes and the complexity of glycosylation in pancreatic cancer cells with high resolution which is not readily observable using end point analysis or other low-resolution approaches that average the binding responses over multiple cells. This real-time SPR Microscopy approach allows for a more accurate understanding of binding interactions of potential therapeutic drugs in the native heterogenous cellular environments.
Author: Nguyen Ly and Miyuki Thirumurthy | Biosensing Instrument | Published August 12th, 2024
DOWNLOAD PDF
Download a PDF of Application Note 159: Real-Time Monitoring of Glycan Heterogeneity in Cancer Cells
- Cournia Z, Allen TW, Andricioaei I, Antonny B, Baum D, Brannigan G, et al. (2015) Membrane Protein Structure, Function, and Dynamics: a Perspective from Experiments and Theory. Journal of Membrane Biology 248 doi: 10.1007/s00232-015-9802-0.
- Varki A KS (2017) Historical Background and Overview. In: Varki A, Cummings RD, Esko JD et al. (ed) Essentials of Glycobiology [Internet], 3rd ed. Cold Spring Harbor Laboratory Press, Cold Spring; Harbor (NY).
- Mattox, Daniel E., and Chris Bailey-Kellogg. "Comprehensive analysis of lectin-glycan interactions reveals determinants of lectin specificity." PLoS Computational Biology 17.10 (2021): e1009470.
- Hashim OH, Jayapalan JJ, Lee CS (2017) Lectins: An effective tool for screening of potential cancer biomarkers. PeerJ 2017:. doi: 10.7717/peerj.3784.
- Xu J, Yang X, Mao Y, Mei J, Wang H, Ding J, et al. (2021) Removal of N-Linked Glycosylation Enhances PD-L1 Detection in Colon Cancer: Validation Research Based on Immunohistochemistry Analysis. Technol Cancer Res Treat 20:. doi: 10.1177/15330338211019442
- Aguilar Díaz de león, Jesús S., Miyuki Thirumurty, and Nguyen Ly. "Surface plasmon resonance microscopy identifies glycan heterogeneity in pancreatic cancer cells that influences mucin-4 binding interactions." Plos one 19.5 (2024): e0304154.
- Naismith JH, Field RA (1996) Structural basis of trimannoside recognition by concanavalin A. Journal of Biological Chemistry 271:. doi: 10.1074/jbc.271.2.972
- Ohyama Y, Kasai KI, Nomoto H, Inoue Y (1985) Frontal affinity chromatography of ovalbumin glycoasparagines on a concanavalin A-Sepharose column. A quantitative study of the binding specificity of the lectin. Journal of Biological Chemistry 260:. 10.1016/s0021-9258(18)88862-7