Dynamic diseases like cancer become more heterogeneous over the course of the disease. Due to the heterogeneity, the malignant tumor can harbor a collection of cells with different molecular signatures. This might result in non-uniform distribution of subpopulations of cells in the disease sites (spatial heterogeneity) or variations in the molecular makeup of cells within the same population (temporal heterogeneity)1. Accurate assessment of the heterogenous malignant cells is essential for the development of effective therapies. A key step in the development of a drug is to screen various candidates by determining their affinities towards a cellular target and the kinetics of the interactions in a heterogenous native environment. Gaining insights into two-dimensional receptor-ligand binding kinetics is of value to understand numerous physiological and pathological processes leading to new strategies in drug design and discovery2.
Cell heterogeneity is always present to some level in most cell populations. Also, cell-to-cell differences can alter the receptor-ligand binding reaction significantly and the ensemble behaviors of a population may not represent the behaviors of any individual cell. This heterogeneity arises among cells mainly as a consequence of genetic change, environmental variations and changes in the cellular properties3.
This application note focuses on Dong et al recent work in studying the effect of cell heterogeneity on binding kinetics and the use of SPRm 200 – a Surface Plasmon Resonance Microscopy (SPRM) instrument to gauge the effects of cell heterogeneity in a population4. SPRM tackles this issue of cellular heterogeneity with its unique ability to measure label-free the binding kinetics and phenotype of each individual cell. In this way, a statistical analysis of the cell population can be produced to determine the heterogeneous range of binding interactions (Figure 1) and identify the predominant modes of binding interactions.
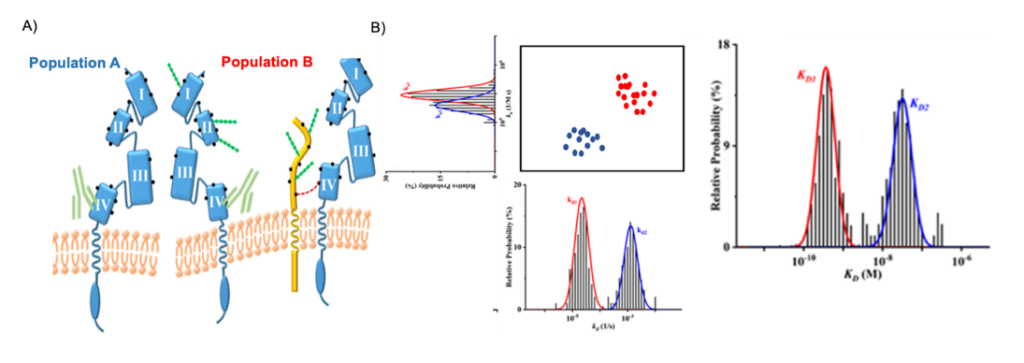
Figure 1. (A) Schematic representations of the anti-HER2 antibody binding to heterogenous HER2 molecules (Population A- non-glycosylated HER2 and Population B- Glycosylated HER2). The residues on HER2 comprising the primary amine groups are depicted as black dots, and the N-linked glycans are shown as strings of green beads. The four domains on the extracellular segment of HER2 are identified. In population B, a mucin molecule is used to represent all HER2-neighboring proteins such as the epidermal and insulin-like growth factor receptors. (B) Binding kinetics measurements of a heterogeneous population using SPRm 200.
This study examines the heterogeneity caused by aberrant protein glycosylation occurring in the human epidermal growth factor receptor 2 (HER2) protein, a member of the tyrosine kinase receptor family as seen in Figure 1. HER2 is over-expressed in 25–30% of breast cancers and can form homo- or heterodimers (with HER1, HER3 or HER4) triggering a series kinase/AKT pathways5. In the past, HER2 has been targeted with the monoclonal antibody drug Herceptin and other anti-HER2 antibodies6. Some cancer patients develop herceptin resistance due to the masking or physical blockade of HER2 receptors by glycans or large glycoproteins like MUC4. There are reported scenarios wherein a glycosylated HER2 is cross-linked to its non-glycosylated (native) counterpart. Mucin 4 (MUC4), a large and highly glycosylated transmembrane protein, is one of several proteins that can co-localize with HER27. The presence of proteins like MUC4 have been shown to impede the binding of Herceptin to HER2. Depending on the relative locations of MUC4 and other epidermal and insulin like growth factor receptors, the binding kinetics vary from cell to cell. Thus, there can be myriad arrangements of HER2 and glycosylated HER2 molecules with respect to other types of neighboring proteins. All of these contribute to the cell-to-cell variations (heterogeneity) or even variations among subcellular locations in the kinetic values. Although kinetic values of purified proteins serve as good guides for drug development, it is very clear that results obtained with cell-based methods are more biologically meaningful and pharmacologically relevant as they address the cell-cell variations in depth.
Dong et al studied the conjugation of an anti-HER2-antibody to the HER2 receptor on SKBR3 cells to address cell heterogeneity using SPRm 200. The affinity and kinetic values obtained are listed in Table 1.
| HER2 and anti-HER2 FITC Interaction | ka x 104 [1/M*s] | kd x 10-4[1/s] | KD [nM] |
| Native in-cell HER2, SKBR3 cells (glycosylated – peak) | 4.16 | 13.4 | 32.0 |
| (non-glycosylated – peak) | 8.60 | 0.25 | 0.34 |
Table1: Kinetic parameters measured from anti-HER2 and HER2 binding interaction of the native in-cell forms.
The ImageSPR™ software from Biosensing Instrument Inc. was used for simulating the SPRM sensorgrams and statistical analyses of cell heterogeneity. The cell-to-cell variations in the kinetic values of native HER2 molecules (glycosylated as well in this study) are relatively wide. Studies have shown that the cell surface proteins are often heavily glycosylated and it has been postulated that such glycosylation may affect epitope accessibility and drug binding to receptor proteins. The binding interaction in this study follows a typical 1:2-type kinetic model, where interactions are stronger with the native receptor and the weaker binding to the glycosylated receptor were reported (Figure 2). The association rate constant (ka) is faster on non-glycosylated cells, suggesting that the glycans on the glycosylated HER2 hinder the antibody binding to domain IV.
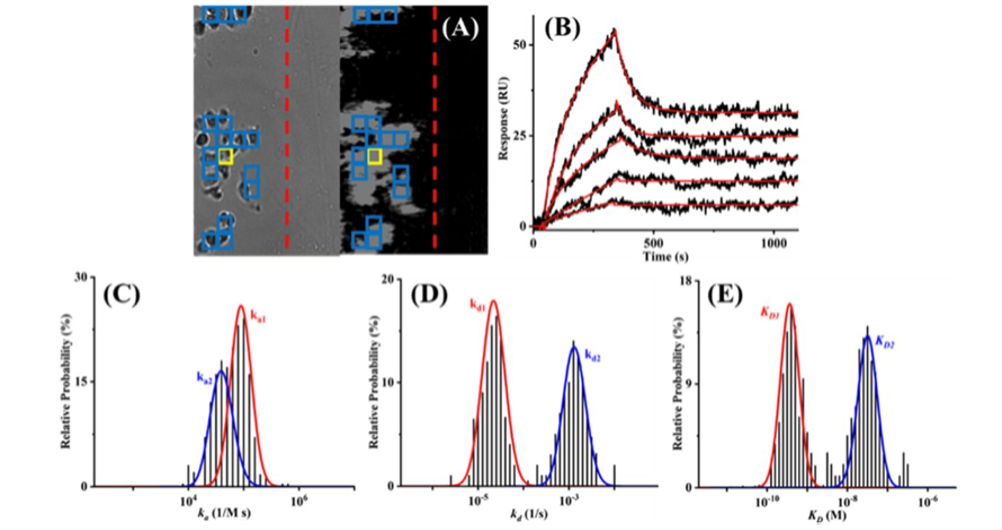
Figure 2. (A) Bright-field (left) and SPRm 200 (right) images of SKBR cells showing the barrier (dashed red line) separating the reference and cell-covered areas and the ROI (thickened yellow box) used to obtain the representative sensorgrams in (B). Injected solutions contained 1.00, 5.00, 10.0, 20.0, and 50.0 nM antibody and the red curve is the simulated sensorgram based on the 1:2 binding model. Histograms of ka1 and ka2 (areas under the red and blue curves in C, respectively), kd1 and kd2 (D), and KD1 and KD2 (E), obtained by simulating sensorgrams from all ROIs marked by the blue boxes in (A).
Heterogeneity is the fundamental property of cellular systems but there can be loss of information due to ensemble averages at many scales of biology, from single molecules to communities of whole populations. Hence it is key to understand heterogeneity as it may serve as an informative readout of population physiology and predictors of responses to perturbations. Also, understanding the difference between cellular kinetics due to cell heterogeneity that can affect the fidelity of the kinetic values, is important for guiding the drug discovery process and for evaluating drug efficacy and the associated side effects in clinical settings.
Author: Nguyen Ly and Miyuki Thirumurthy | Biosensing Instrument | Published September 30, 2023
DOWNLOAD PDF
Download a PDF of Application Note 151: Studying Cell Binding Heterogeneity using SPRm 200
- Yuan, Yinyin. "Spatial heterogeneity in the tumor microenvironment." Cold Spring Harbor perspectives in medicine 6, no. 8 (2016): a026583.
- An, Chenyi, Xiaohuan Wang, Fan Song, Jinglei Hu, and Long Li. "Insights into intercellular receptor-ligand binding kinetics in cell communication." Frontiers in Bioengineering and Biotechnology 10 (2022).
- Altschuler, Steven J., and Lani F. Wu. "Cellular heterogeneity: do differences make a difference?." Cell 141, no. 4 (2010): 559-563.
- Dong, Tianbao, Chaowei Han, Xin Liu, Zhichao Wang, Yanhui Wang, Qing Kang, Pengcheng Wang, and Feimeng Zhou. "Live Cells versus Fixated Cells: Kinetic Measurements of Biomolecular Interactions with the LigandTracer Method and Surface Plasmon Resonance Microscopy." Molecular Pharmaceutics 20, no. 4 (2023): 2094-2104.
- Slamon, Dennis J., William Godolphin, Lovell A. Jones, John A. Holt, Steven G. Wong, Duane E. Keith, Wendy J. Levin et al. "Studies of the HER-2/neu proto-oncogene in human breast and ovarian cancer." Science 244, no. 4905 (1989): 707-712.
- Kute, Timothy, Christopher M. Lack, Mark Willingham, Bimjhana Bishwokama, Holly Williams, Kathy Barrett, Tanita Mitchell, and James P. Vaughn. "Development of Herceptin resistance in breast cancer cells." Cytometry Part A: the journal of the International Society for Analytical Cytology 57, no. 2 (2004): 86-93.
- Barok, Mark, Heikki Joensuu, and Jorma Isola. "Trastuzumab emtansine: mechanisms of action and drug resistance." Breast cancer research 16, no. 2 (2014): 1-12.