The long and arduous process of drug development involves screening of drug candidates by determining their affinities towards a cellular target and the kinetics of the interactions. A variety of methods both labeled and label-free like surface plasmon resonance (SPR)1,2, biolayer interferometry (BLI)3,4, quartz crystal microbalance (QCM)5, and surface acoustic wave (SAW)6 are used for kinetic studies of isolated proteins extracted from cells or recombinantly expressed. These techniques require isolated protein to be immobilized onto a sensor surface for its interaction with an analyte in solution to be measured.
Unfortunately, heterologous protein expression and purification can be tedious and may introduce uncertainties like changes in native conformation which may change the structure and behavior of the expressed protein7,8. Furthermore, the binding kinetics of an isolated receptor can be drastically different from that of its native in-cell counterpart due to various cell-based heterogeneous factors such as cell phenotype and growth cycle, membrane rigidity, receptor accessibility and confirmation, and neighboring protein influences9. These physiological differences between native and isolated receptors and their potential effect on receptor function, makes cell-based methods for kinetic interaction analysis more pharmacologically relevant and biologically meaningful.
Several methods can be employed to measure binding kinetics with native in-cell receptors such as Surface Plasmon Resonance Microscopy (SPRM)10, Ligand Tracer (LT)11 and Quartz Crystal Microbalance (QCM)12. However, SPRM is the only technique with single-cell resolution, thus enabling it to directly address the issue of cellular heterogeneity. This inherent heterogeneity produces a broad range of binding interaction behaviors that should not be treated homogeneously by simply averaging the behaviors of the entire cell population together, as is the common practice 13.
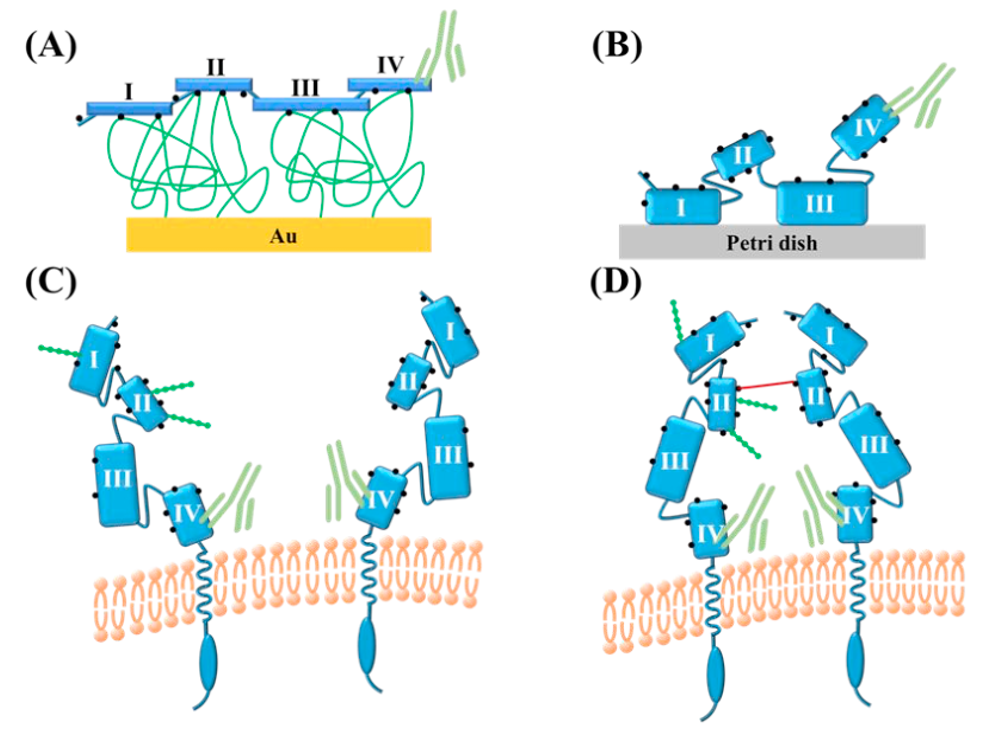
Figure 1: Schematic representations of the anti-HER2 antibody binding to HER2 molecules in different forms: Purified rHER2 (A) amine-coupled to CM-dextran, and (B) hydrophobically adsorbed onto the petri dish surface. Native in-cell HER2 of (C) live cell, and (D) fixed cell. The residues on HER2 comprising the primary amine groups are depicted as black dots and the N-linked glycans are shown as strings of green beads. The four domains on the extracellular segment of HER2 are identified. The solid red line represents paraformaldehyde molecules that may link the adjacent proteins through any of their primary amine groups14.
In this study, the binding kinetics of native and recombinant forms of the Human epithelial growth receptor 2 (HER2) were studied and compared in detail14. The orientations of the HER2 receptor in both the recombinant and in-cell forms can be different due to various factors. In Figure 1, the recombinant form of HER2 is depicted immobilized via (A) amine coupling and (B) electrostatically on a petri-dish. Immobilization of the isolated receptor permits orientations where domain 4 of the recombinant HER2 (rHER2) receptor can be readily accessible. However, the native in-cell receptor is oriented such that the binding domain IV lies tucked very closely to the cell membrane of (C) live and (D) fixed cells. Therefore, the cell membrane could significantly influence the interaction by imposing a certain amount of steric hindrance to the antibody. From the inspection of various receptor orientations, it is clear that isolation of the HER2 receptor makes the binding domain IV more readily accessible than that of its native in-cell form.
The binding interaction kinetics of the anti-HER2 antibody to HER2 in SKBR3 cells was studied with a SPRm200 system14 and compared to the kinetic binding values obtained from isolated rHER2. The SKBR3 cells were incubated and allowed to adhere to one-half of a poly-d-lysine coated sensor surface (Figure 2A). The other half of the sensor surface was used as a reference area. A kinetic titration injection series was performed such that the cells were exposed to serial injections of six anti-HER2-FITC solutions (1.00, 5.00, 10.00, 20.00, and 50.00 nM).
ImageSPR™ software was used for analyzing the SPRM sensorgrams. Representative binding responses from a single region of interest (ROI) is shown in Figure 2B. The binding responses observed in the blue colored ROIs were analyzed to produce the binding histograms in Figures 2C-E. A Gaussian distribution was fit to the histograms to determine the mean and 95% confidence interval for each kinetic parameter. The binding interaction between the antibody and the native HER2 receptor follows a 1:2 binding model. This observation is in good agreement with prior studies which showed that Herceptin binds to domain IV of both native and glycosylated HER2 receptors in a 1:2 binding fashion, e.g., more strongly to the non-glycosylated receptors and more weakly to the glycosylated receptors15
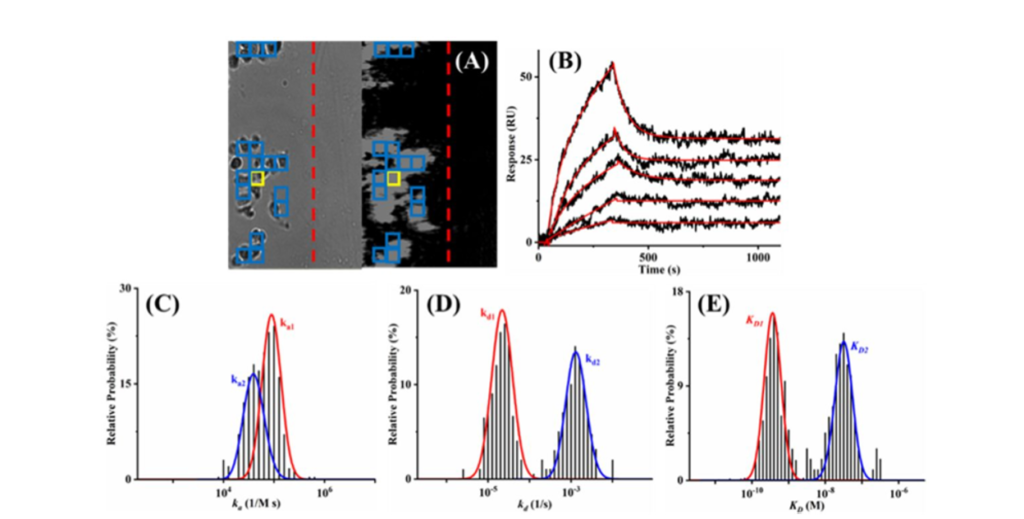
Figure 2: (A) SPRm200’s Bright-field (left) and SPR images (right) of fixed SKBR cells showing the barrier (dashed red line) separating the reference from the cell-covered areas. (B) Representative sensorgrams measured from the ROI (thickened yellow box). The injected solutions contained 1.00, 5.00, 10.00, 20.00, and 50.00 nM anti-HER2 antibodies and the red curve is the simulated fit based on the 1:2 binding model. Histograms of (C) association rate constants ka1 and ka2 (areas under the red and blue, respectively), (D) dissociation rate constants kd1 and kd2, and (E) equilibrium dissociation constants KD1 and KD2, obtained by kinetics analysis of responses from ROIs marked by the blue boxes in (A).
The kinetic interaction values obtained from the native in-cell receptors of the SKBR3 cells were compared to the values obtained from the isolated and immobilized form of recombinant rHER2 receptors. The binding study for the rHER2 protein was performed on a five channel BI-4500A SPR system with the BI-DirectFlow™ technology. The rHER2 molecules were immobilized via amine-coupling to a carboxymethylated dextran (CM-dextran) sensor chip.
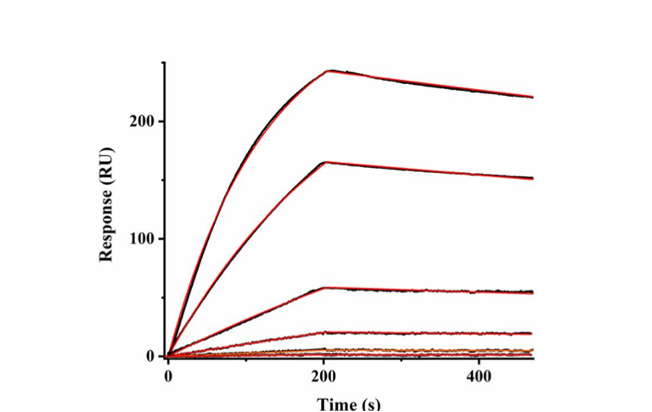
Figure 3: (A) Experimental sensorgrams (black curves) showing binding of anti-HER2 antibody (0.500, 1.50, 4.50, 13.5, 36.0, and 54.0 nM) to recombinant HER2 (rHER2) amine- coupled to CM-dextran, overlaid with the simulated sensograms (in red).
The lack of glycans on the rHER2 receptor supports a simpler 1:1 interaction kinetic model for binding analysis (Figure 3). As shown in Table 1, native in-cell receptors have slower association rates than their recombinant counterparts. This is especially true for the second set of in-cell kinetic peaks that are attributed to glycosylation, which shows a ~3.5 times slower associationrate and ~17 times weaker affinity. It is suspected that the orientation of the isolated rHER2 receptor and the lack of glycan hindrance helps to increase accessibility of the binding domain IV of the rHER2 receptor enabling a faster antibody association rate and stronger affinity16
| HER2 and anti-HER2 FITC Interaction | ka x 104 [1/M*s] | kd x 10-4 [1/s] | KD [nM] |
| Native in-cell HER2, SKBR3 cells (glycosylated – peak) (non-glycosylated – peak) | 4.16 8.60 | 13.4 .250 | 32.0 0.34 |
| Recombinant HER2 | 14.6 | 2.76 | 1.88 |
Table1: Kinetic parameters measured from anti-HER2 and HER2 binding interaction of the native in-cell and recombinant forms.
Distinctly different interaction behaviors were observed between the native in-cell receptor form and the immobilized recombinant receptor form. These differences highlight the importance of studying native cell-based kinetics for drug development to more thoroughly assess the pharmacological efficacy, biorelevant pharmacokinetics, and fundamental cellular processes.
Author: Nguyen Ly and Miyuki Thirumurthy | Biosensing Instrument | Published June 6, 2023
DOWNLOAD PDF
Download a PDF of Application Note 147: Variations in the Binding Kinetics of Native and Recombinant Protein Receptors
- Wang, Qi, et al. "Research advances on surface plasmon resonance biosensors." Nanoscale 14.3 (2022): 564-591.
- Olaru, Andreea, et al. "Surface plasmon resonance (SPR) biosensors in pharmaceutical analysis." Critical reviews in analytical chemistry 45.2 (2015): 97-105.
- Tao, Yi, et al. "Tailored biosensors for drug screening, efficacy assessment, and toxicity evaluation." ACS sensors 6.9 (2021): 3146-3162.
- Petersen, Rejane L. "Strategies using bio-layer interferometry biosensor technology for vaccine research and development." Biosensors 7.4 (2017): 49.
- Migoń, Dorian, Tomasz Wasilewski, and Dariusz Suchy. "Application of QCM in peptide and protein-based drug product development." Molecules 25.17 (2020): 3950.
- Mandal, Debdyuti, and Sourav Banerjee. "Surface acoustic wave (SAW) sensors: Physics, materials, and applications." Sensors 22.3 (2022): 820.
- Hartl, F. Ulrich, and Manajit Hayer-Hartl. "Converging concepts of protein folding in vitro and in vivo." Nature structural & molecular biology 16.6 (2009): 574-581.
- Das, Anirban, et al. "Rational design of protein-specific folding modifiers." Journal of the American Chemical Society 143.44 (2021): 18766-18776.
- Iqbal, Nida, and Naveed Iqbal. "Human epidermal growth factor receptor 2 (HER2) in cancers: overexpression and therapeutic implications." Molecular biology international 2014 (2014).
- Zhou, Xiao Li, et al. "Surface plasmon resonance microscopy: From single‐molecule sensing to single cell imaging." Angewandte Chemie International Edition 59.5 (2020): 1776-1785.
- Björke, Henrik, and Karl Andersson. "Measuring the affinity of a radioligand with its receptor using a rotating cell dish with in situ reference area." Applied Radiation and Isotopes 64.1 (2006): 32-37.
- Chen, Jennifer Y., Lynn S. Penn, and Jun Xi. "Quartz crystal microbalance: Sensing cell-substrate adhesion and beyond." Biosensors and Bioelectronics 99 (2018): 593-602.
- Pohlmann, P. R.; Mayer, I. A.; Mernaugh, R., Resistance to Trastuzumab in Breast Cancer. Clin. Cancer Res. 2009, 15 (24), 7479-7491.
- Dong, Tianbao, et al. "Live Cells versus Fixated Cells: Kinetic Measurements of Biomolecular Interactions with the LigandTracer Method and Surface Plasmon Resonance Microscopy." Molecular Pharmaceutics (2023).
- Peiris, Diluka, et al. "Cellular glycosylation affects Herceptin binding and sensitivity of breast cancer cells to doxorubicin and growth factors." Scientific reports 7.1 (2017): 1-11.
- Cho, Hyun-Soo, et al. "Structure of the extracellular region of HER2 alone and in complex with the Herceptin Fab." Nature 421.6924 (2003): 756-760.