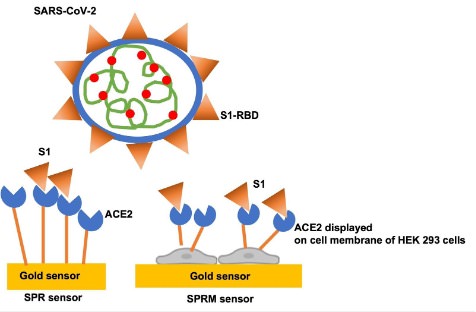
The pandemic due to the SARS-CoV-2 continues to evolve and remains an international concern. Covid infection is caused by the air-borne coronavirus 2 (SARS-CoV-2) and its mutants. The viral invasion of the host cells is mainly through the viral attachment to angiotensin (Ang)-converting enzyme 2 (ACE2) present in the epithelial cells of the host1. During a viral infection, the trimeric S protein is cleaved into S1 and S2 subunits, where the S1 subunit contains the receptor binding domain (RBD), which directly binds to the peptidase domain of ACE22. Therefore, a better understanding of the binding interaction between S1 and ACE2 is key for the development of antiviral drugs.
Kinetic interaction studies with membrane proteins using SPR typically require their isolation and purification from the host cell environment. In our prior works, isolated human ACE2 with a His-tag and an Avi-tag were immobilized for kinetic binding interaction studies with SARS-CoV-2 S1 protein. Both kinetic titration injection assay3 and a quicker single injection assay4 were implemented, using a five channel BI-4500A SPR system with the BI-DirectFlow™ technology to measure the binding kinetics of the interaction. The results were in good agreement with published literature.
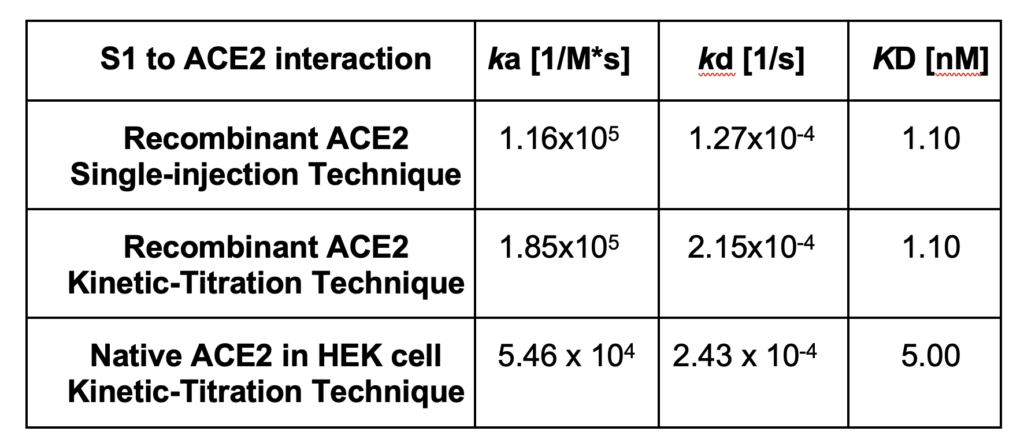
However, the conformation of an extracted or recombinant receptor might be different than that of the same receptor in the membrane milieu. These alterations can influence the natural function and binding behavior of the receptors5,6. Therefore, measurements of the binding affinity and kinetic parameters of membrane proteins in their natural environment may be more accurate and biologically relevant for drug development and testing.
Surface plasmon resonance microscopy (SPRM), such as BI’s SPRm200, integrates label-free, high-resolution SPR binding kinetic measurements with bright-field optical microscopy for the study of biomolecular interactions on whole cells, including characterization of the binding heterogeneity of cell populations since the binding responses of each cell is individually observed.
The interaction of the S1 spike protein to the ACE2 receptor on HEK 293 cells was measured using the SPRm200 instrument. To do this, HEK 293 cells were seeded and allowed to adhere to the sensor surface. After cell fixation, serial injections of six S1 spike protein solutions (12.00, 19.25, 38.50, 77.00, 154.00, and 192.50 nM) were exposed to the cells. The bright-field image in Figure 2a corresponds with the SPR image in Figure 2b.
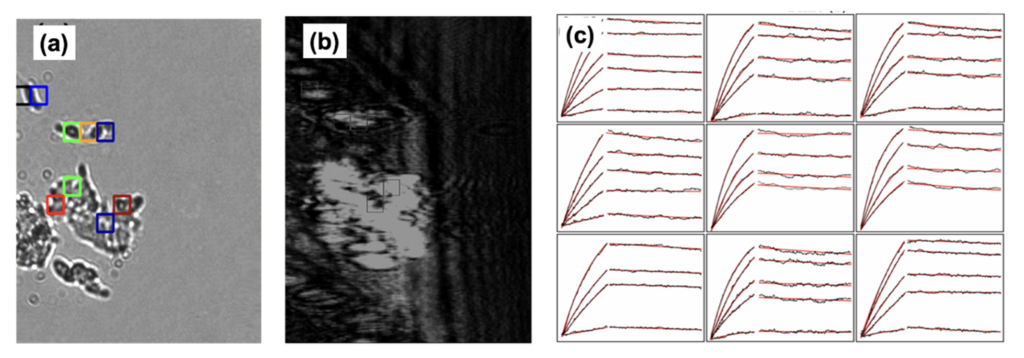
For kinetic analysis, a virtual grid containing regions of interest (ROIs) was applied to the surface. ROIs defined by the colored squares in both the bright-field and SPRm200 images produced the binding responses observed in the sampling of sensorgrams in Figure 2c (response data shown in black). A 1:1 kinetic interaction model was fitted to the binding data for kinetics analysis, producing the simulated sensorgrams that overlay the data shown in red, which closely fit the experimental data shown in black.
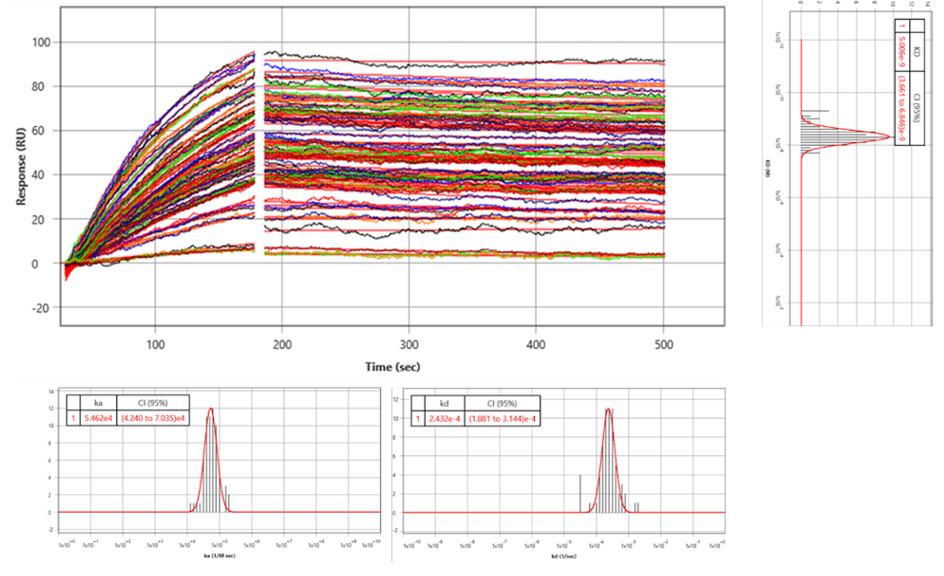
The kinetic analysis results from all ROIs were gathered to form histograms of the kinetic parameters shown in Figure 3. A Gaussian distribution was fit to the histograms to determine the mean and 95% confidence interval for each kinetic parameter. From the statistical analysis, the kinetic values for the entire cell population were determined to be ka of 5.46 x 10⁴ M-1s-1, kd of 2.43 x 10⁻⁴ s, and KD of 5.00 x 10⁻⁹ M (see Table 1).
As previously described, the kinetic interaction of S1 to the recombinant ACE2 receptor exhibits an affinity of 1.10 nM. In contrast, the native cell-based environment exhibits a weaker 5.0 nM affinity with broader distribution, having a 95%CI of 3.6 to 6.8 nM. Furthermore, we note that the association rate constant appears to be more influenced by the extraction and purification process than the dissociation rate constant. These effects on the kinetic behavior are attributed to the heterogeneity and complexity of the cellular environment. This work highlights the need for cell-based kinetic binding studies for extracting more biologically relevant information.
Author: Nguyen Ly and Miyuki Thirumurthy | Biosensing Instrument | Published December 1, 2022
DOWNLOAD PDF
Download a PDF of Application Note 145: KINETIC MEASUREMENTS OF COVID-19 VIRAL S1 PROTEIN WITH CELLULAR AND RECOMBINANT ACE2 RECEPTORS
- Abassi Z, Higazi AAR, Kinaneh S, Armaly Z, Skorecki K and Heyman SN, ACE2, COVID-19 Infection, Inflammation, and Coagulopathy: Missing Pieces in the Puzzle. Front. Physiol. 11:574753 (2020)
- Renhong Yan, Yuanyuan Zhang, Yaning Li, Lu Xia, Yingying Guo, Qiang Zhou, Structural basis for the recognition of SARS-CoV-2 by full-length human ACE2, Science 367, 1444–1448 (2020)
- Kinetic Measurement of COVID-19 S1 Protein and ACE2 Binding
- Single-Injection Kinetic Measurement Technique for studies of Covid-19 S1 Protein and ACE2 Binding
- Wrapp, D.; Wang, N.; Corbett, K. S.; Goldsmith, J. A.; Hsieh, C. L.; Abiona, O.; Graham, B. S.; McLellan, J. S., Cryo-EM Structure of The 2019-nCoV Spike in the Prefusion Conformation. Science 2020, 367 (6483), 1260-1263.
- Raghu, D.; Hamill, P.; Banaji, A.; McLaren, A.; Hsu, Y.-T., Assessment of the Binding Interactions of SARS-CoV-2 Spike Glycoprotein Variants. J. Pharm. Anal. 2022, 12 (1), 58-64.