Kinetics of an antibody-antigen interaction forms the basis for immunological response and antibody therapeutics,
which is one of the fastest areas of growth in the pharma industry. Affinity and avidity of antibodies are the characteristics which define the overall efficacy of binding kinetics.1 These properties enable a new wave of antibody drugs with tailored properties, promising improved therapeutics.2 Hence, a technology capable of differentiating antibody affinity and avidity on whole cells with emerging antibody modalities will be crucial in drug development.
Traditional tools like ELISA study the effects of avidity of purified ligands and this end-point assay does not provide kinetic, thermodynamic, and/or stoichiometric information.3 Techniques like SPR explore avidity and affinity by varying the ligand density on the surface and not in the native form. In contrast, unique technique like Surface Plasmon Resonance Microscopy (SPRM) can characterize affinity and avidity, association rates, and dissociation rates in the native cell environment. In this study, performed in collaboration with Ellaine Mai at Genentech using SPRM technology, a SPRm 200 system was used to explore the effect of avidity and affinity interactions of Herceptin, a bivalent antibody, on both MCF-7 and SKBR3, low and high HER2 expressing cell lines, as shown in (Figure 1) respectively.4
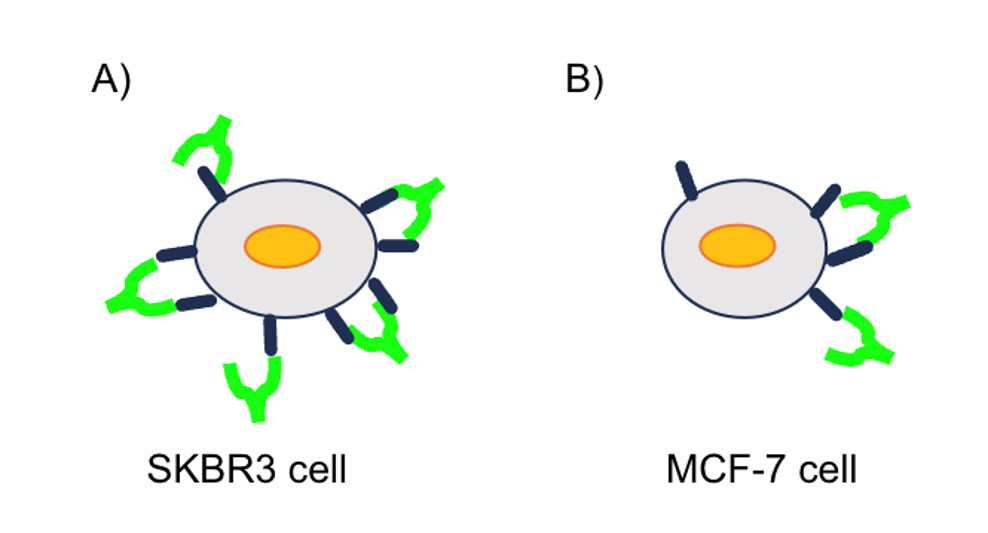
Figure 1: Schematic representation of (A) Bivalent binding of Herceptin to SKBR3 (high HER2 expressing cell line) and (B) bivalent binding of Herceptin to MCF-7 (low HER2 expressing cell line).
The SPRm 200 system combines bright field optical imaging and high-resolution imaging based SPR measurements.5 SPRM data was analyzed statistically using BI’s powerful ImageSPR™ analysis software. Areas that observed biding interactions were marked with colored squares and designated as regions of interest (ROIs) for kinetics analysis. The ROIs overlap well with the cells, indicating high selectivity to cells and low non-specific binding.
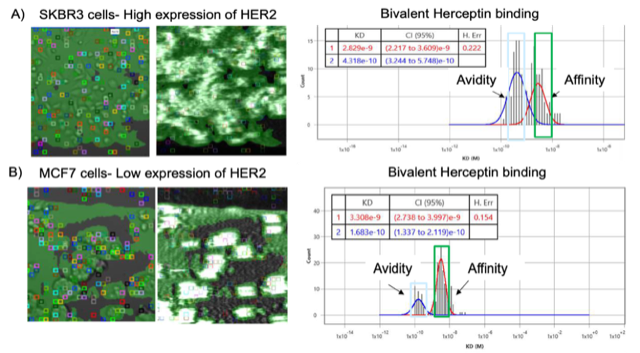
Figure 2: SPRm 200 results of bivalent Herceptin binding to HER 2 expressing cells. (A) Bivalent Herceptin bound to SKBR3 cells with high HER2 expression. (B) Bivalent Herceptin bound to MCF7 cells with low HER2 expression. Brightfield images are located on the left. Colored squares indicate ROIs where antibody binding events were detected. Regions highlighted in green indicate areas of cell contact. On the right side are representative histogram distributions for the equilibrium dissociation constant (KD) generated from kinetic analysis of ROI sensorgrams.
| Cell Lines | HER2 Expression | Analytes | Avidity peak height | Affinity peak height | Ratio of Avidity to Affinity peak height | KD (nM) |
| SKBR3 | High | Herceptin | 15 | 10 | 1.5x | 2.8 and 0.43 |
| MCF7 | Low | Herceptin | 6 | 22 | 0.25x | 3.3 and 0.17 |
Table1: Kinetic parameters measured from Herceptin binding interactions with HER2 receptor in the native in-cell environment of SKBR3 and MCF7 cell line.
In the SPRm 200 kinetics analysis for high HER2 expressing SKBR3 cells (Figure 2A), Herceptin binding with two arms results in two KD peaks. The shorter peak with weaker affinity, which as expected, is similar in KD value to that of the monovalent antibody (See Application Note 153). The taller peak with stronger affinity is attributed to avidity. For the SKBR3 high HER2 expression cells, the Herceptin avidity peak height is ~1.5x greater than the affinity peak as shown in Figure 2A. Meaning multi-arm avidity binding occurs more frequently than single arm affinity binding. However, for the MCF7 low HER2 expression cells, the avidity peak height is ~.25x lower than the affinity peak (Figure 2B). This is expected, as receptors would be located further apart from each other, resulting in less likelihood of neighboring-receptor avidity interactions. These results are summarized for comparison in Table 1.
This SPRm 200 binding interaction study of Herceptin shows that different cell lines produce varying amounts of affinity and avidity interactions based upon HER2 receptor expression levels. This study highlights SPRM’s unique ability to readily investigate binding heterogeneity and measure both affinity and avidity binding interactions. This capability of SPRm 200 is granted by its powerful sub-cellular resolution and would not be readily possible with the use of lower resolution or end-point measurement approaches.
Author: Nguyen Ly and Miyuki Thirumurthy | Biosensing Instrument | Published Jan 22nd, 2024
DOWNLOAD PDF
Download a PDF of Application Note 154: Measuring Affinity and Avidity under High and Low Expression Conditions
- Oostindie, Simone C., Greg A. Lazar, Janine Schuurman, and Paul WHI Parren. "Avidity in antibody effector functions and biotherapeutic drug design." Nature Reviews Drug Discovery 21, no. 10 (2022): 715-735.
- Brinkmann, Ulrich, and Roland E. Kontermann. "The making of bispecific antibodies." In MAbs, vol. 9, no. 2, pp. 182-212. Taylor & Francis, 2017.
- Dimitrov, J. D., Lacroix-Desmazes, S., & Kaveri, S. V. (2011). Important parameters for evaluation of antibody avidity by immunosorbent assay. Analytical biochemistry, 418(1), 149-151.
- Slaga, Dionysos, Diego Ellerman, T. Noelle Lombana, Rajesh Vij, Ji Li, Maria Hristopoulos, Robyn Clark et al."Avidity-based binding to HER2 results in selective killing of HER2-overexpressing cells by anti-HER2/CD3." Science translational medicine 10, no. 463 (2018):
- Wang W, Yang Y, Wang S, Nagaraj VJ, Liu Q, Wu J, et al. Label-free measuring, and mapping of binding kinetics of membrane proteins in single living cells. Nat Chem. 2012;4(10):846–53. Pmid:23000999.