SPRm 200 system is the world’s first commercial Surface Plasmon Resonance Microscopy (SPRM) which combines the high spatial resolution of optical microscopy with the label-free sensing capability of SPR. With this instrument, drug molecules binding with membrane proteins on single whole cells can be directly detected and quantified.
In this application note, we describe the measurement of the equilibrium constant (KD) and kinetic constants (ka and kd) of wheat germ agglutinin (WGA, 36k MW) binding with glycoproteins of Human Burkitt’s lymphoma B cells (Ramos cells). Glycoproteins are membrane proteins that play an important role in cell recognition and communications.(1) Quantifying the binding activities between lectins (e.g., WGA) and glycoproteins provides critical information related to the nature, distribution and biological role of sugar groups on the cell surface.(2)
Several chemistries to immobilize suspension cells on the SPR sensor surface has been demonstrated.(3) Here, the suspension Ramos cells were captured and immobilized on the SPR cell sensor which was pre-treated with a commercial cell adhesive (e.g., Corning’s Cell-TakTM). Four different concentrations of WGA molecules are introduced to study the binding of the molecules with membrane receptors on the cells. The binding affinity and kinetics are determined by analyzing data from several hundred ROIs (Regions of Interest) on the cell surface. ImageSPRTM software provides statistical analysis of binding affinity and kinetic constants in addition to providing the 95% confidence interval (CI) data for each measurement.
The equilibrium and kinetic constants obtained were KD= 7.5 nM (CI 6.1 – 9.3), ka= 2.5 x 10⁵ M-1 s-1 (CI 2.1 – 2.9) and kd= 2.0 x 10⁻³ s-1 (CI 1.7 – 2.4). These values are in close agreement with previous SPRM studies done with adherent cell lines.(4)

FIG. 1 Bright field image of immobilized Ramos cells on SPR sensor surface (left) and SPRm image of WGA binding to cell membrane protein (right)
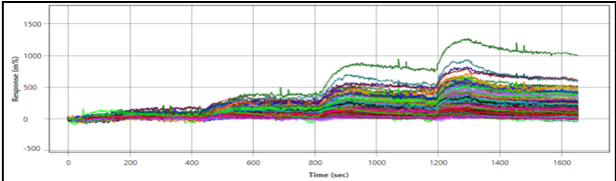
FIG. 2 Real time sensorgrams of binding
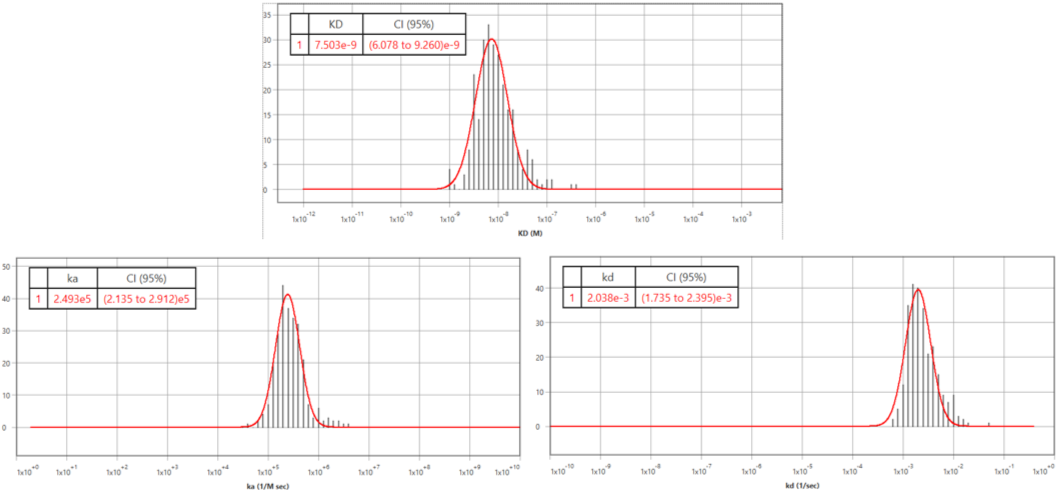
FIG. 3 Histogram of measured KD (top), ka (bottom left) and kd (bottom right)
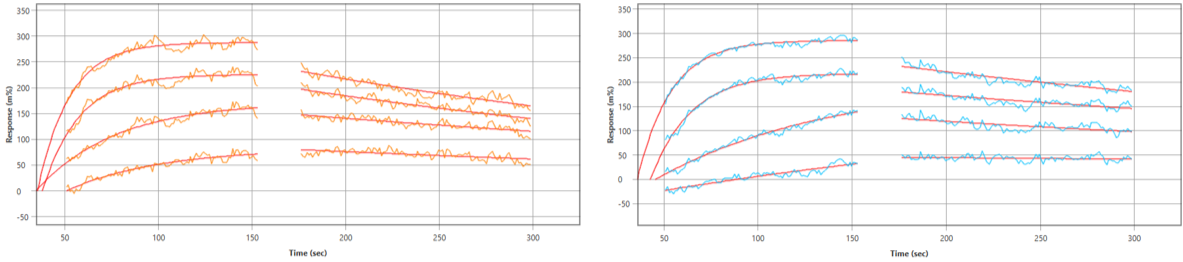
FIG. 4 Individual kinetic fits of a couple ROIs
We acknowledge Jonathan Brooks, Pfizer, Cambridge, MA for providing the samples and valuable discussions.
Author: Nguyen Ly | Biosensing Instrument | Published Jan 4, 2025
DOWNLOAD PDF
Download a PDF of Application Note 131: SPR Microscopy for Live Suspension Cells
- Dell, A. et al, Science 2001, 291, 2351-2356
- Durand, G et al, Clinical Chemistry 2000, 46, 795-805
- Yanase, Y et al, Biosensors and Bioelectronics 2007, 23, 562-567
- Biosensing Instrument application note #125 https://biosensingusa.com/application-notes/application-note-125-lectin-glycoprotein-interactions-spr-microscopy/