The accurate characterization of binding kinetics of therapeutic antibodies to tumor cells is critical to advancing therapeutic drug development.1,2,3 SPR microscopy (SPRM) is a label free technology utilized for studying binding interactions of drug compounds to membrane proteins without extracting proteins from the cell, ensuring intact native conformations of the membrane proteins. Additionally, SPRM is unique in its ability to study binding heterogeneity, with the capacity to differentiate between single and multiple modes of binding interactions.4
Avidity refers to the accumulated strength of multiple affinities of individual non-covalent binding interactions. It is a more complex type of binding event that can occur with multi-valent forms of biomolecules, such as antibodies. Unfortunately, traditional measurement techniques are unable to readily distinguish between the avidity and affinity modes of binding interaction. As a result, more cumbersome assays are required that intentionally suppress avidity in order to more accurately measure affinity. Such approaches commonly include the use of engineered monovalent antibodies or suppression of receptor densities. Consequently, measurements resulting from such adulterated conditions are not biologically relevant, frequently leading to misguided and costly outcomes for drug development.
In contrast, SPRM has a unique ability to resolve binding heterogeneity so that the native interaction modes of avidity and affinity can be readily distinguished. To highlight this capability, various anti-HER2 interactions with HER2 expressing cells were studied. In the first part of the study, two different antibodies that target the HER2 membrane protein on the MCF-7 cell were studied: (1) an engineered one-arm monovalent anti-HER2 anti-body (Figure 1A) and (2) Herceptin a bivalent anti-HER2 anti-body (Figure 1B).5
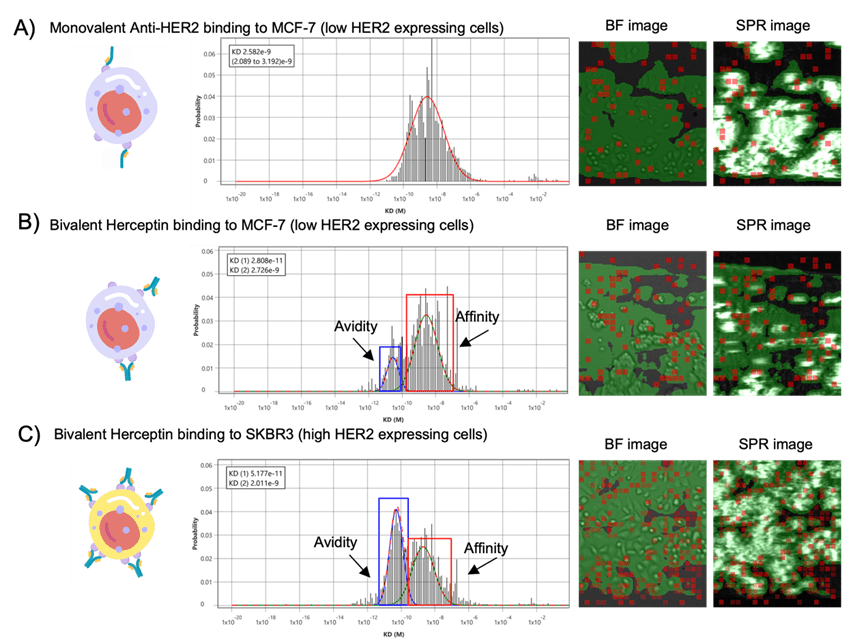
Figure 1: Comparison data of (A) engineered monovalent Anti-HER2 binding interactions to MCF-7 cells, (B) bivalent anti-HER2 Herceptin binding interactions to MCF-7 cells and (C) bivalent anti-HER2 Herceptin binding interactions to higher HER2 expressing SKBR3 cells. On the left side are illustrations depicting the types of interactions. In the center are KD histograms of the measured binding interactions. On the right side are brightfield and SPR images of the cell population with sub-cellular resolution. Red squares indicate locations where binding events are observed, and they overlap well with cell regions highlighted in green, validating a high degree of cell-specific interactions.
As can be seen in Figure 1A, the engineered single-arm antibody produces a single affinity peak with KD value of ~2.6 nM. However, in Figure 1B binding interactions of the naturally bivalent two-armed anti-HER2 antibody produce two predominant interaction peaks with KD values of ~2.7 and ~0.03 nM. The larger KD peak overlaps very closely with the engineered single arm KD peak, suggesting that this larger KD peak represents the
single-arm affinity binding mode of interaction, and that the smaller KD peak represents a two-arm avidity mode of interaction, supported further with a relatively higher affinity value. Such detailed observation of heterogeneous binding interactions more accurately reflects the natural and physiological binding conditions of the cellular microenvironment that are not readily possible with other label-free techniques.
To further expand the study, the interaction of bi-valent anti-HER2 was studied with cells having much greater HER2 expression levels (SKBR3). As can be seen in Figure 1C, the two KD peaks of the higher HER2 expressing SKBR3 cells overlap very closely with those of the lower expression MCF-7 cells. Additionally, it is worth noting that the height of the avidity peak of the SKBR3 cells is ~2 times greater than that of the affinity peak. Conversely, with the lower HER2 expressing MCF-7 cells the height of the avidity peak is ~1/3 that of the affinity peak. This suggests that with the higher HER2 expressing SKBR3 cells, the avidity modes of interactions are much more frequent than the affinity modes of interaction. This correlation of increasing avidity interaction events with receptor density is in agreement with expectations.6 The results are summarized in Table 1.
| Cell Lines | HER2 Expression | Analytes | Valency of the antibody | Ratio of Avidity to Affinity peak height | KD (nM) |
| MCF7 | Low | Herceptin | Bivalent | 0.3x | 2.7 and 0.03 |
| SKBR3 | High | Herceptin | Bivalent | 2x | 2.0 and 0.05 |
Table1: Summary of results on single- and double-arm anti-HER2 antibody interactions with low (MCF7) and high (SKBR3) HER2 expressing cells. Bivalent antibodies produce two KD peaks, each representing an affinity or avidity mode of interaction. Occurrence of avidity interaction events relative to affinity interaction events increase with increasing HER2 expression.
As demonstrated here, binding interaction studies with single (monovalent) and double-arm (bivalent) antibodies and with high and low receptor-expressing cells highlight SPRm 200’s unique ability to measure binding heterogeneity so that the various interaction modes of affinity and avidity may be studied.
Author: Nguyen Ly and Miyuki Thirumurthy | Biosensing Instrument | Published May 12, 2025
DOWNLOAD PDF
Download a PDF of Application Note 153: Exploring Affinity, Avidity, and Valency using SPRM
- Hartl, F. Ulrich, and Manajit Hayer-Hartl, Nature structural & molecular biology 16.6 (2009): 574-581.
- Das, Anirban, et al. "Rational design of protein-specific folding modifiers." Journal of the American Chemical Society 143.44 (2021): 18766-18776.
- Brinkmann, Ulrich, and Roland E. Kontermann. "The making of bispecific antibodies." In MAbs, vol. 9, no. 2, pp. 182-212. Taylor & Francis, 2017.
- Wang W, Yang Y, Wang S, Nagaraj VJ, Liu Q, Wu J, et al. Label-free measuring and mapping of binding kinetics of membrane proteins in single living cells. Nat Chem. 2012;4(10):846–53. Pmid:23000999.
- Slaga, Dionysos, Diego Ellerman, T. Noelle Lombana, Rajesh Vij, Ji Li, Maria Hristopoulos, Robyn Clark et al. "Avidity-based binding to HER2 results in selective killing of HER2-overexpressing cells by anti-HER2/CD3." Science translational medicine 10, no. 463 (2018): eaat5775.
- Crow, Matthew J., et al. American Journal of Roentgenology 192.4 (2009): 1021-1028.